Troubleshoot a running lab
Right-click a node, a link, or an interface. Everything you need to look inside a running network is in that menu.
These actions need a running lab, so they are not in the browser sandbox.
Get into a node
Right-click a node on the canvas:
| Action | Does |
|---|---|
| Shell | Opens a shell in the container. In VS Code, node.execCommandMapping can drop you straight into a network OS's CLI. |
| SSH | Opens an SSH session to the node's management address. It logs in with the node's credentials from the topology (set them in the node editor under Configuration → Login Credentials), otherwise with the kind's default user. VS Code also uses the identity-file. |
| Logs | Follows the container's log as the node writes it. |
| Start, Stop, Restart | Acts on this node's container only. |
| Info | Shows the node's kind, image, state, addresses, and live CPU and memory usage. |
The same node in the explorer has a few more, such as copying its name, addresses, or image.
In VS Code, terminals open as VS Code terminals. The desktop and web apps open them in terminal windows inside the app, connected through the lab host.
A terminal keeps running on the lab host when the connection drops or you reload the page. The terminal window reconnects by itself and shows what the node printed in the meantime. Opening the same terminal in another browser window moves it there; Continue here takes it back. A terminal without a window ends after 30 minutes, and the window then offers to start a new session. Closing a terminal tab ends its session right away. Labs on a lab host need a recent clab-api-server for this; with an older one, a dropped connection ends the terminal. Terminals opened by older versions of the apps also end when their connection drops.
Read logs
Logs opens the node's log at its last 200 lines and keeps adding new lines while Follow is on. Timestamps, log levels, and key=value pairs are colored, and lines the node wrote to stderr are marked. Source switches to another node of the lab, or to the log of the lab's last deploy, apply, or destroy in this window. Find filters the lines, and Export saves them.
Watch node usage
Select a node of a running lab to see its CPU and memory usage in the info panel, with the last two minutes as a chart. 100 % CPU is one busy CPU, so a node can show more than 100 %. Labs on a lab host need a recent clab-api-server; the panel says so when the server cannot report usage.
Capture packets
Right-click a node or a link and choose Capture, then tick the interfaces: for a link, one end or both. Choose One Wireshark for all of them together, or One per interface. Wireshark opens in a window, streaming live from the lab host; there is nothing to install on your computer. You can also start a capture from an interface in the explorer.
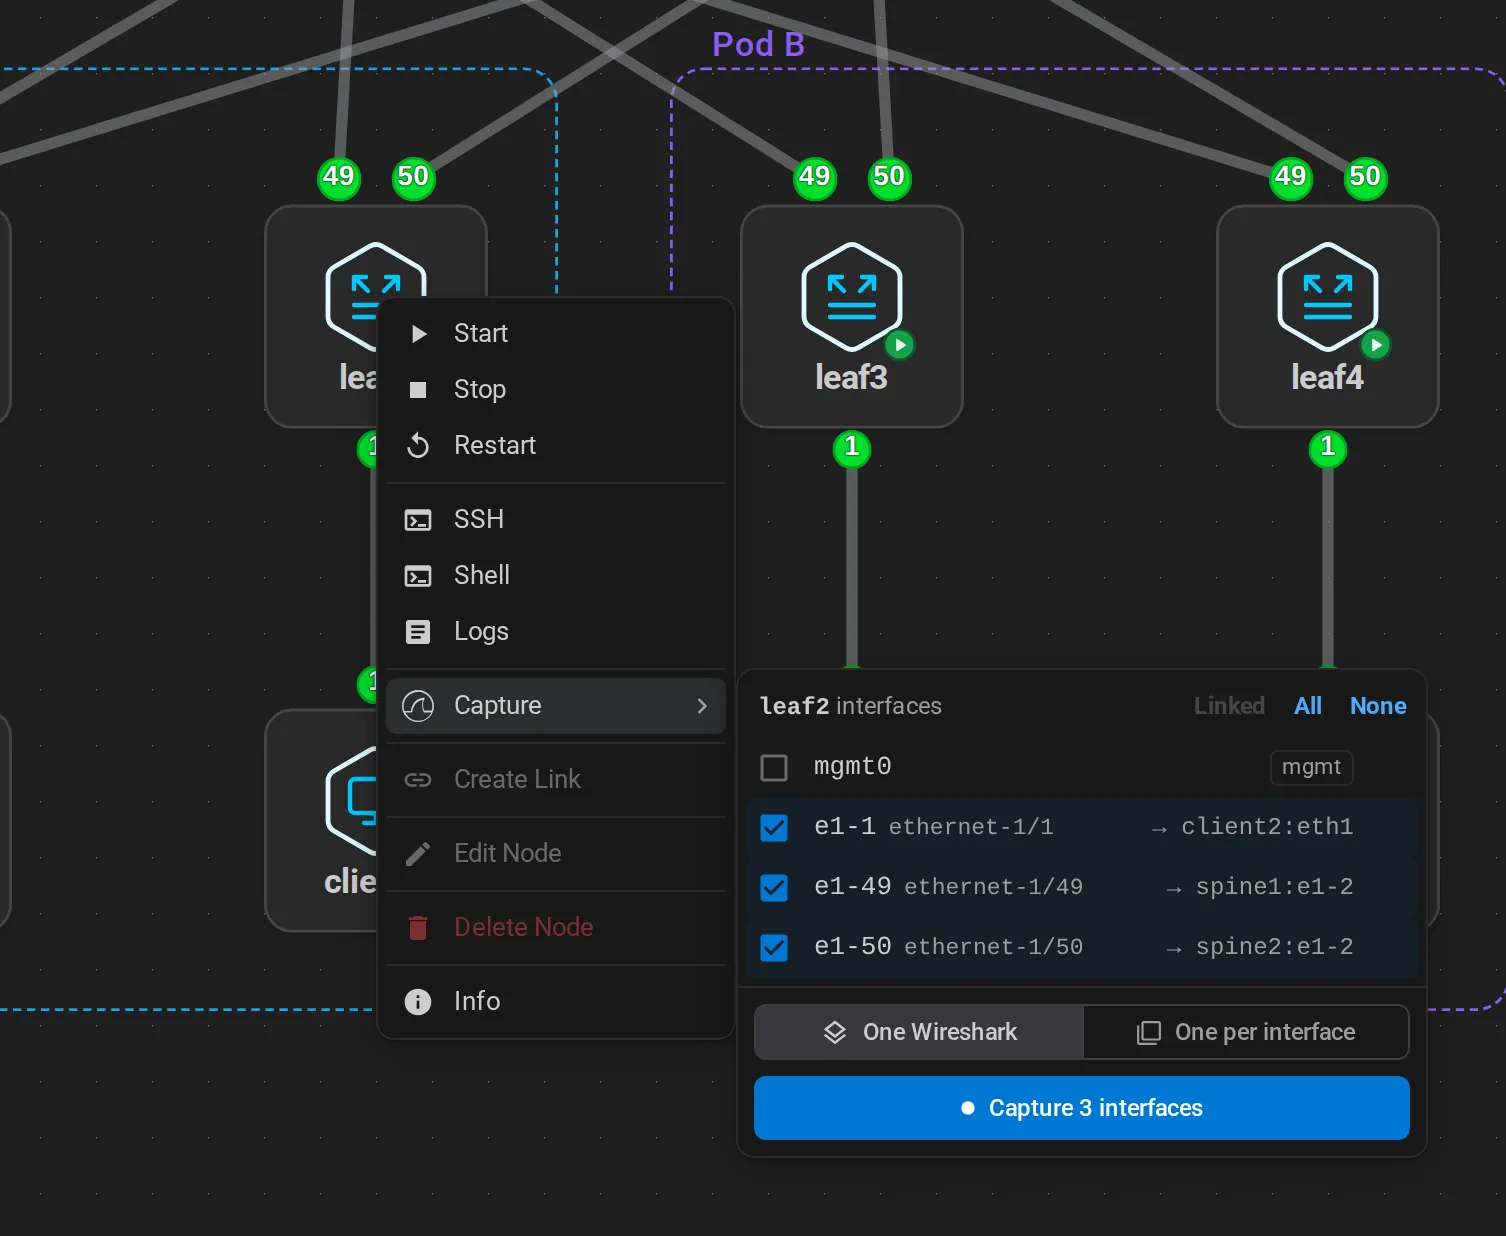
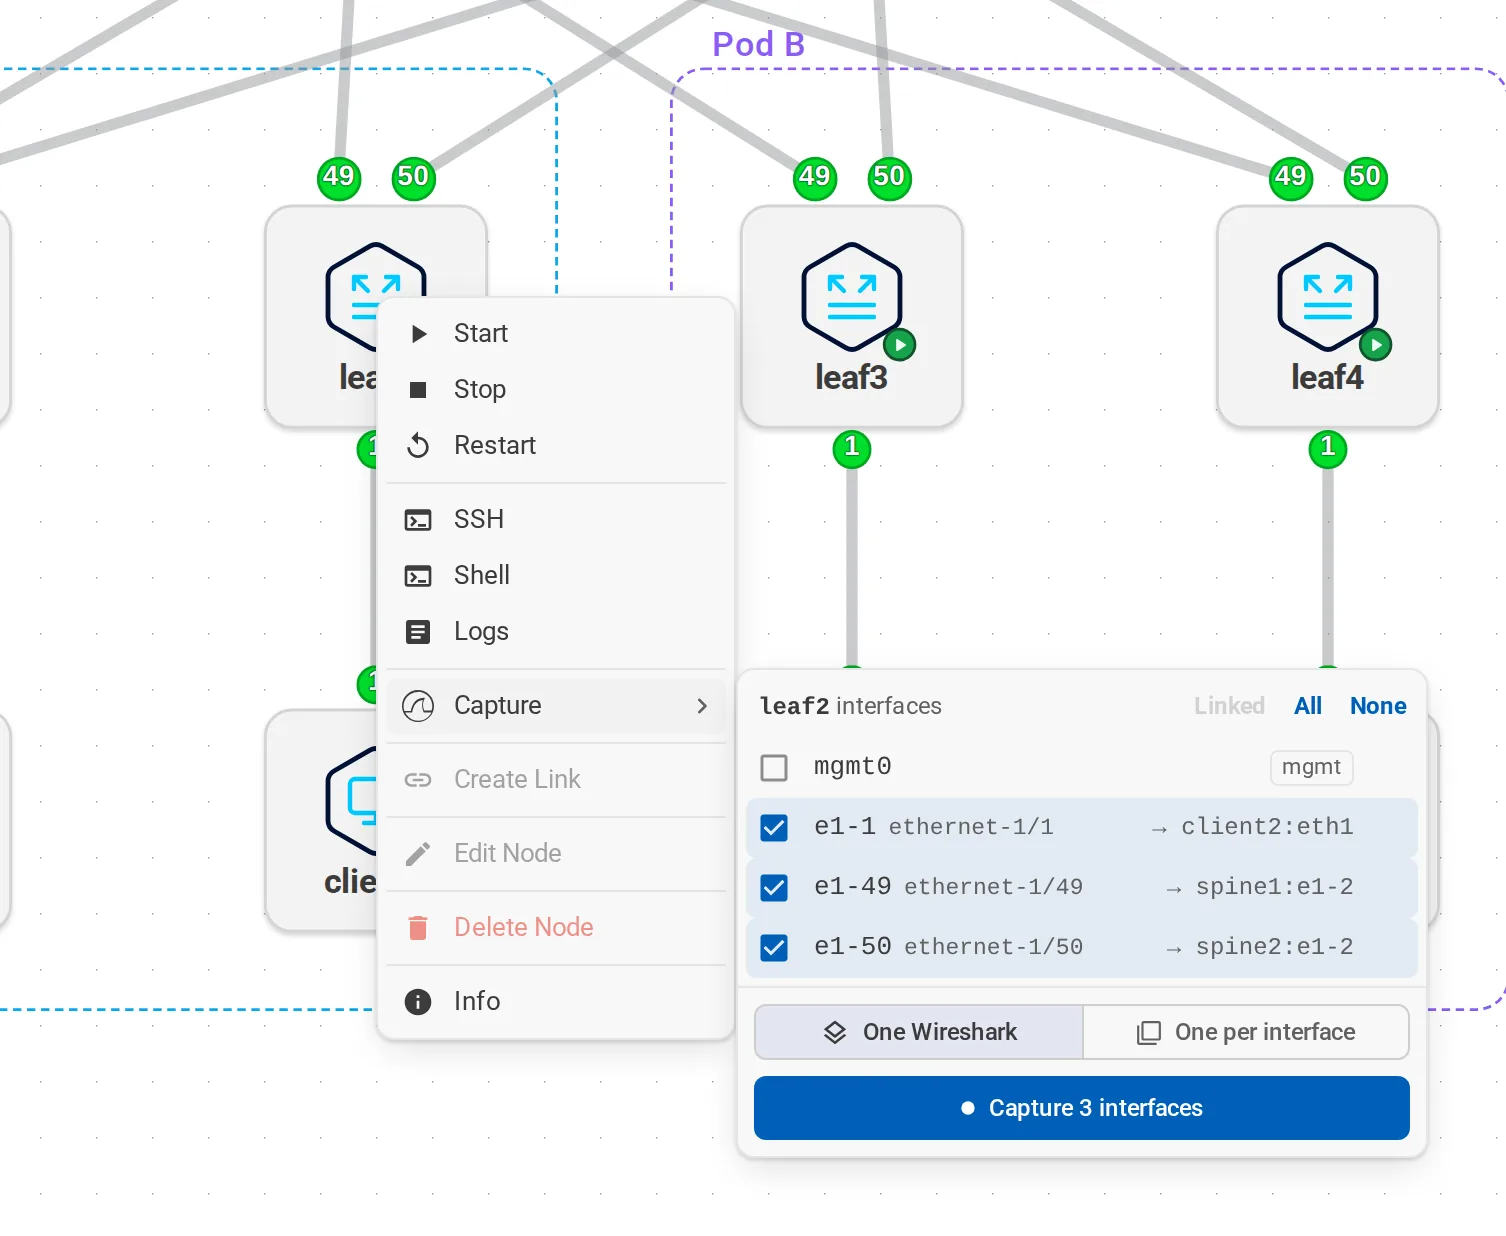
Wireshark VNC runs a Wireshark container on the lab host, so Docker there must be able to pull and run it. To open captures in your own Wireshark or through Edgeshark instead, change the default capture method. Interfaces that are no lab links, such as eth0, and labs whose topology file is gone need Edgeshark running on the lab host.
Impair a link
Right-click a link and choose Link Impairments to add delay, jitter, packet loss, rate limits, or corruption to its interfaces. Use it to see how routing reacts to a bad link without touching the configuration.
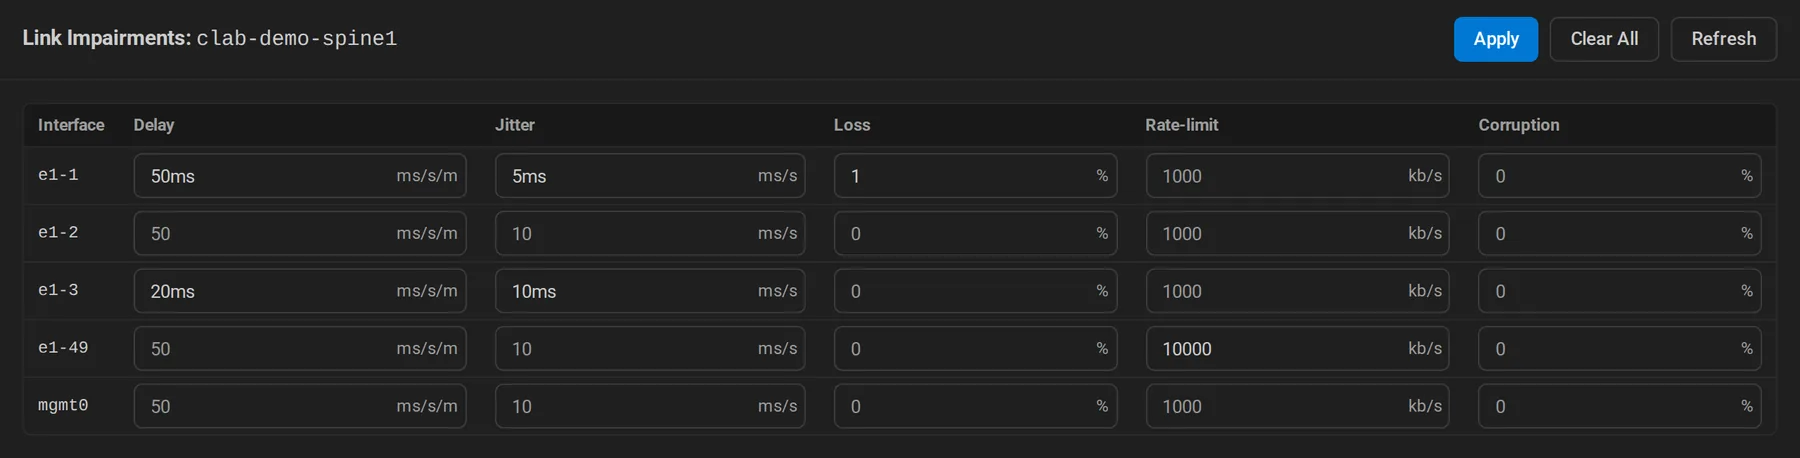
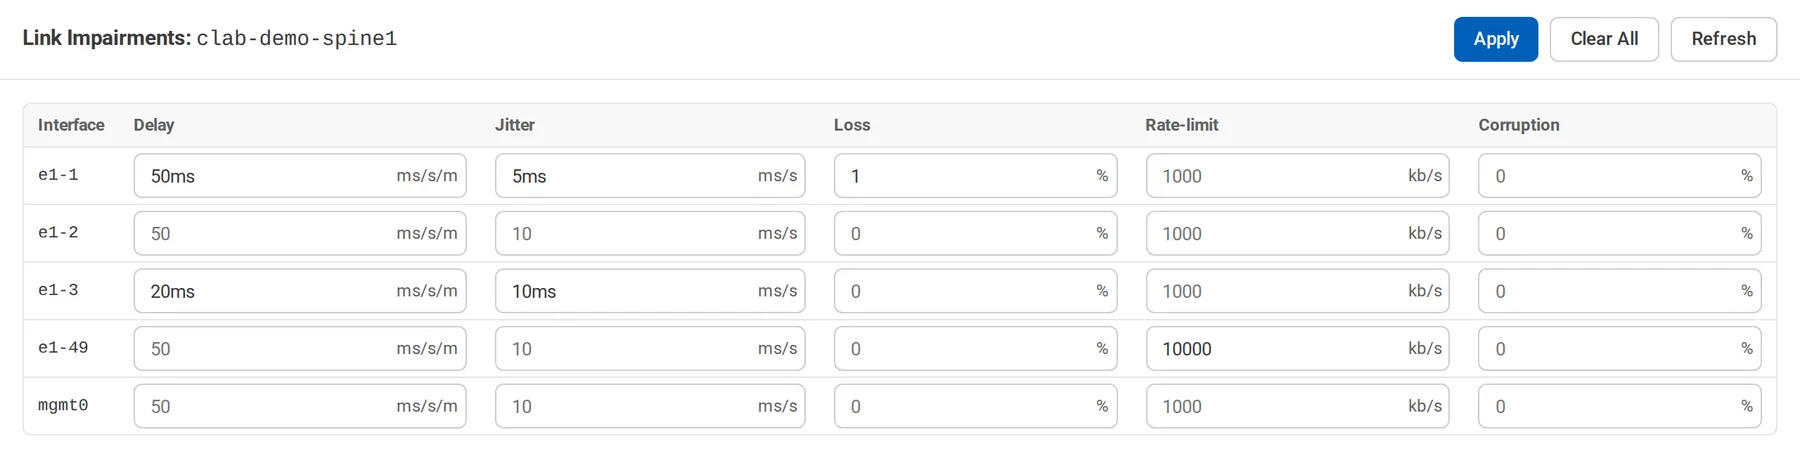
Impairments use Linux traffic control on the lab host and last until you remove them or the lab is destroyed.
Inspect a lab
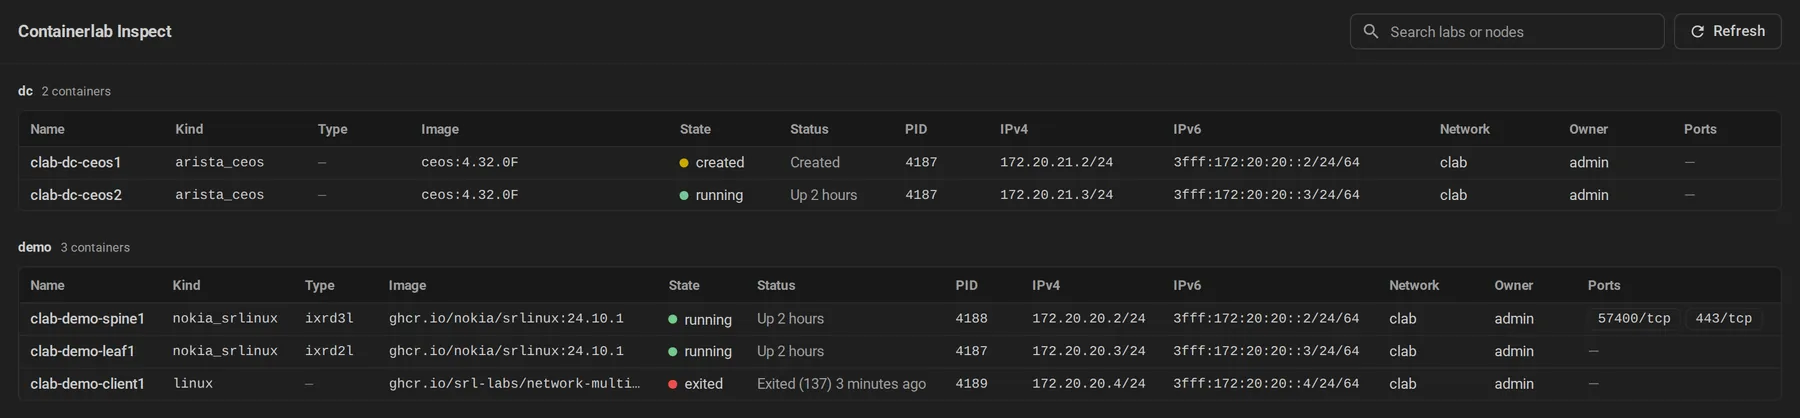
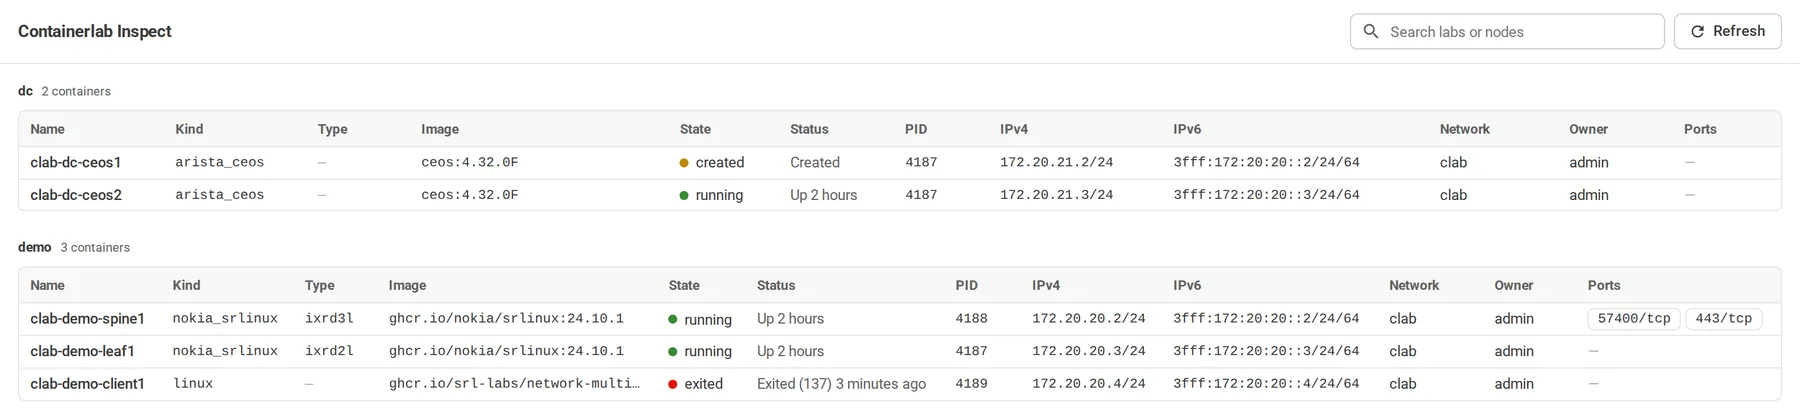
Inspect shows a lab's containers, states, images, and addresses, like containerlab inspect. Inspect All Labs, in the explorer's running labs header, does the same for every lab on the host.
Watch interfaces
Expand a running lab in the explorer down to its interfaces to see live counters. On the canvas, a traffic-rate annotation shows one interface's throughput as a chart or a number; see Layout and style.